A good discussion about education is one about substantive work in academics, athletics, and art (an expansive curriculum).
A few days ago, press releases touted the ACT scores of some of our students over the last three years. The data showed progress from 2011 to 2014, as against the statewide ACT average.
They’re good scores; the students who earned them, and those who taught these students, should be proud.
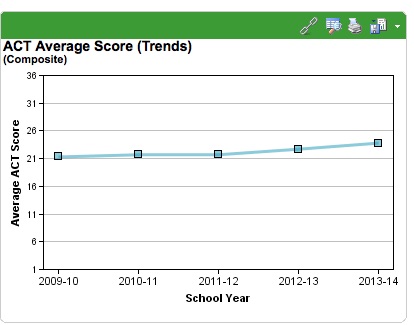
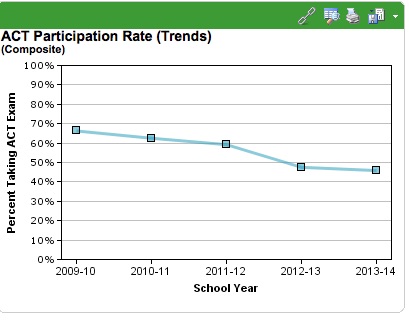
Considering the whole school, as I’ll show, those published results came with a critical omission – although the average ACT at Whitewater High School has gone up, the percentage of students taking the test has fallen significantly.
Whitewater’s better performance comes from a smaller pool of test-takers.
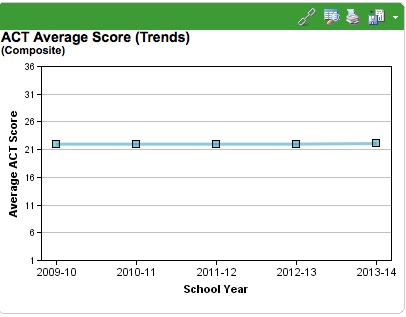
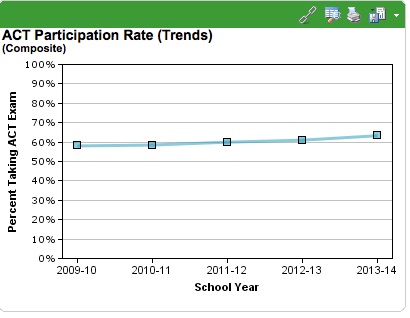
I’ve reproduced the Whitewater High School and the statewide averages, along with the actual participation rates of students’ composite ACT scores, at Whitewater High and statewide, respectively.
Link: WI DPI Dashboard.
What does this mean?
Whitewater’s scores lagged Wisconsin when both school and state participation rates were high; as fewer Whitewater students have taken the test, the school’s scores have gone up.
Locally, test averages have moved in the opposite direction of participation.
(That’s not true for the state: state scores and participation rates have both stayed high.)
Doing well is a personal accomplishment, but it’s easier for a school to do well when the test is confined to a minority of students, rather than when it serves as a measure of most students’ performance.
Pride. An administrator can be proud of those students taking the ACT, but the goal of any administrator should be to move the participation rate up, not let it fall down.
Our schools and community are not meant to be a representation only of a minority; competitive success should be available to all, and within the reach of huge numbers.
Shifting focus? A lower participation rate may be evidence of a shifting focus from substantive academics for college to a non-college focus. There’s an academic and competitive difference between those options.
Straight-forward data. Results should be presented fairly, without omission of crucial facts (such as the decline in ACT participation rates).
Those in eduction, of all fields, should show more care with the forthright presentation of results.
A commitment to education – to being a lifelong learner – is the opposite of sophistry and spin.
In any event, learning over four years, let alone many decades, is more than a single test result.
It matters what made a result possible (what one studied, specifically), and what might do with that knowledge afterward, living in the world.
It’s crazy that people who call themselves educators would throw results out without context.It shows that they want to say things for P.R . value instead of accurately.You hit the nail on the head when you said “Those in eduction, of all fields, should show more care with the forthright presentation of results.”
[…] was not universally required, to make the district look better than its overall performance. See What’s Being Done is More than Just a (Sketchy) Number, Whitewater’s ACT Scores and Participation Rates, The Better, Reasoned Approach on ACT Scores, […]